Beer Game
How do I teach the beer game?
The Opex Analytics Beer Game was developed as an educational tool for practitioners,
students and teachers alike. Our game was designed so that a single person can play in
isolation or a group can be led through it in a classroom setting.
Note: The current release of the Opex Analytics Beer Game allows only
one human player to play on a team along with three computerized players. A future
release allowing four human players is in development and will be available soon.
Still, the current release of the game provides plenty of material for instructors to
demonstrate both the classic beer game lessons as well as insights into how the AI can
be used for supply chain optimization.
The Opex team has a lot of experience teaching the beer game as well as many other
supply chain games and content in educational settings. In what follows, we provide you
with our best practices for teaching the Opex Analytics Beer Game in a classroom
environment.
As previously mentioned in What is the beer game?
, the game has been traditionally used in an academic setting by playing live with four
students sitting around a table using physical cards and chips to represent the
movement of product along the supply chain. The newer computerized versions of the game
add automation and streamlined visualization to the game’s results. Like other
computerized versions of the game, the Opex Analytics Beer Game eliminates the need for
cards and chips and allows students to play the game from their own computers.
Game Introduction
The Opex Analytics Beer Game was developed as an educational tool for practitioners,
students and teachers alike. Our game was designed so that a single person can play in
isolation or a group can be led through it in a classroom setting.
In our experience, students learn best from the beer game when the instructor gives little
or no advice about how to choose order quantities. Instead, we recommend that the
instructor initially provide guidance only on 1) the current state of the supply chain and
2) how to set up the game and play each period.
1) Current State of the Supply Chain:
- The customer demands beer in each time period
- The supply chain is comprised of a Retailer, Distributor, Wholesaler and Manufacturer
- There is no communication with or visibility into other stages (players) in the supply chain
- There are order and shipment lead times
- Unmet demands incur a stockout cost
- Excess inventory incurs a holding cost
- Players are joining the supply chain “in progress”. Orders and shipments already exist in the pipeline.
2) Setup and Play Instructions:
- For detailed instructions, see How do I play the beer game?
- It never hurts to demonstrate yourself playing a few sample periods, either
Game Play
In order to produce results that best highlight the key lessons of the beer game, including
the use of AI, we recommend guiding the students through a few rounds of play with specific
settings. Below, you will find options to guide students through the classic beer game and
its associated learnings as well as rounds focused mainly on the performance of the AI
player.
Guided Rounds
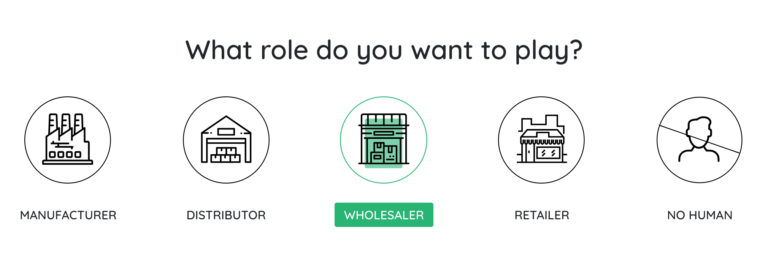
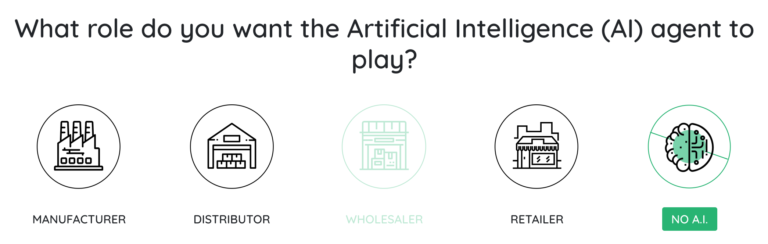
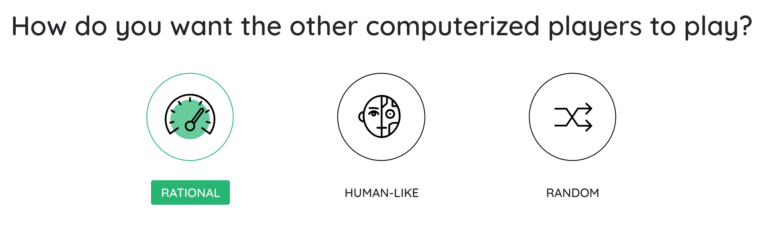
1) One Human Player + Three Human-Like Players (Classic Setup): The
student is the human player and the three computerized players play as “human-like”
players. This is the closest setting to the classic four-player beer game, with the
“human-like” players standing in for the student’s human teammates. The student should play
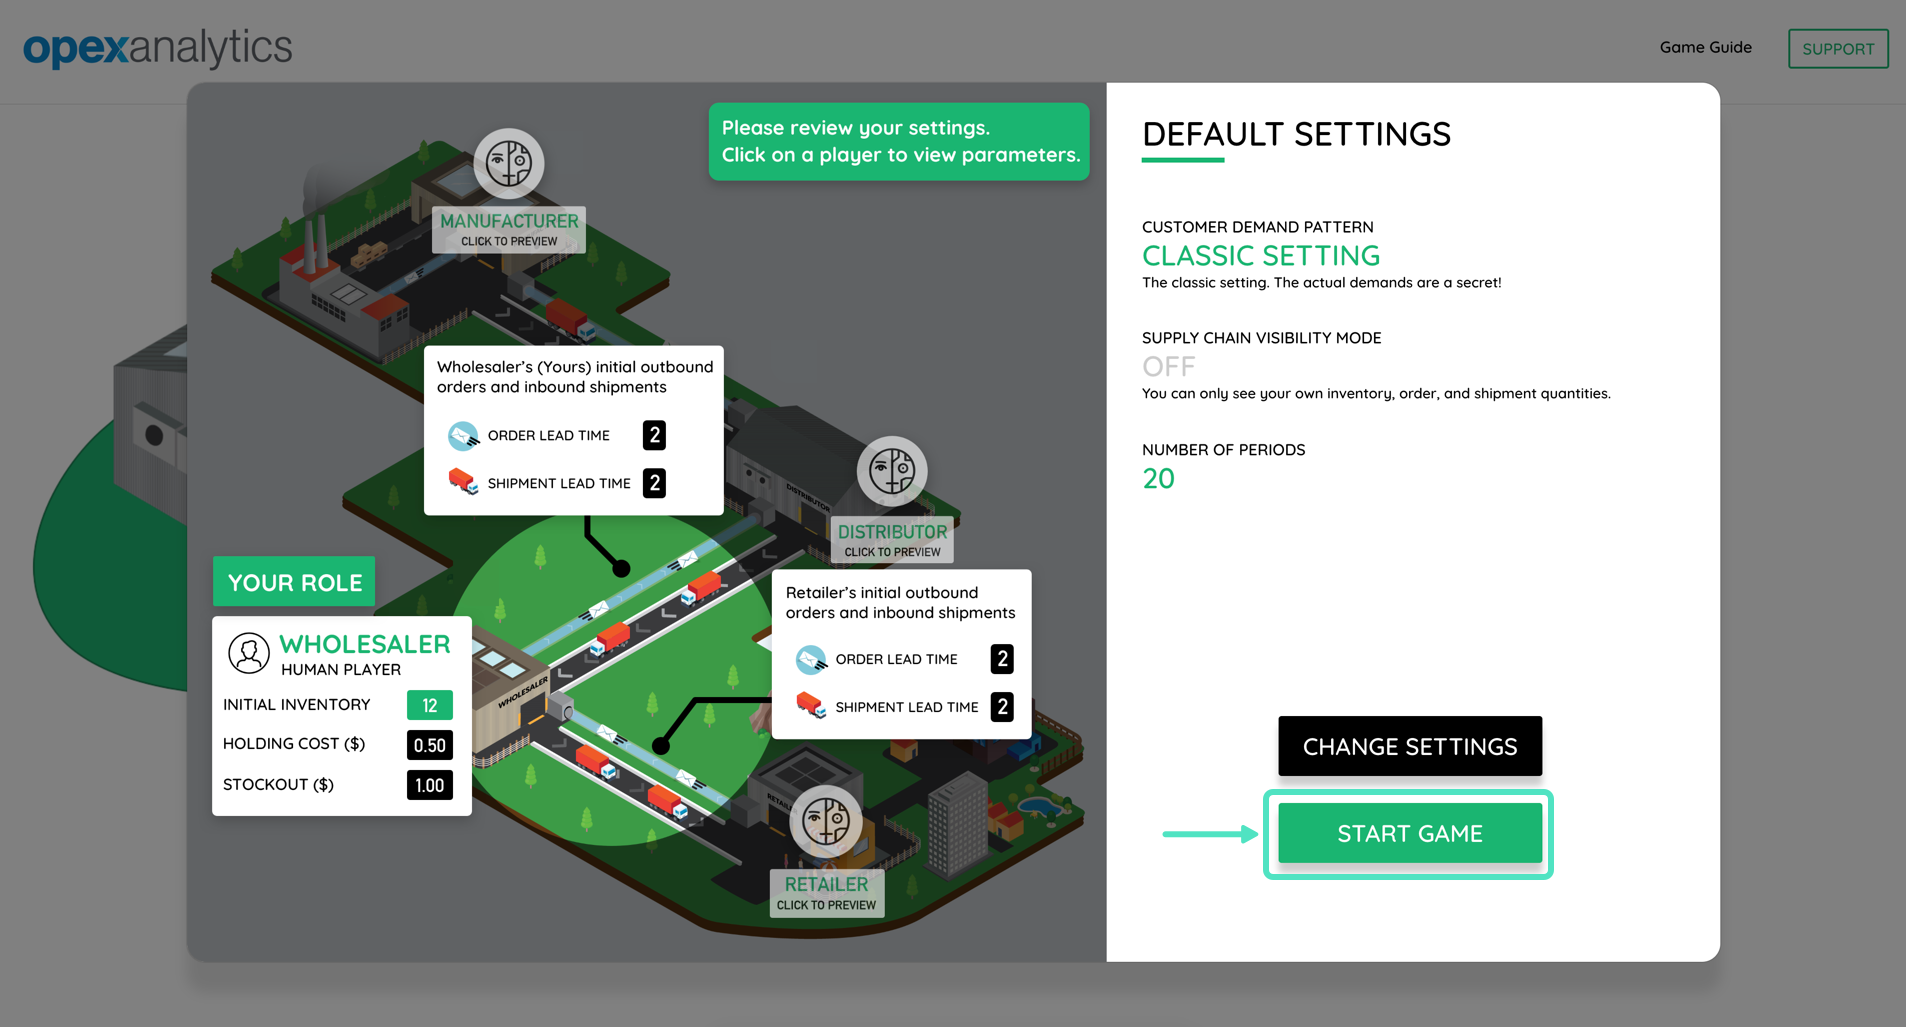
the role of Wholesaler and use the “classic” demand pattern. Note: This is the default
setting. No settings changes are required prior to game play.
2) One Human Player following a Rational Strategy + Three Human-Like Players:
This time we want to guide the student to make ordering decisions following a
base-stock policy (similar to if a Rational computerized player were to take control), to
demonstrate the difference between typical human play and a more stable inventory policy.
(All other settings remain as in Round 1.)
It’s easy to play using a base-stock policy: In period 1, the player should order 8 units.
In every period after that, the player should order the same quantity as the demand he or
she received.
This will implement a base-stock policy with a base-stock level of 32. (In period 1, the
player has a starting inventory level (IL) of 12, plus 16 units on order, and receives a
demand for 4 units. The inventory position (IP) is therefore 12 + 16 − 4 = 24. An order
quantity of 8 brings the IP to 32. In subsequent periods, setting the order quantity to the
demand keeps the IP at 32.) Note that 32 is not necessarily the optimal base-stock level,
since the other players are not following a predictable ordering pattern, but it is
reasonable under these settings.

3)There are two options for how you can run the final round:
a) One Human Player + Three Rational Players: The student plays as the Wholesaler, and the
three computerized players are set for Rational play. All other settings are as in round 1.
b) Four Rational Players (Observation Round) – All four players are computerized and set
for Rational play. The student simply watches the computerized players play.
By default, the game lasts for 20 periods. Some instructors prefer to run the game for 30
or more periods (you can have the students easily change the number of rounds within the
‘Change Settings’ option of the Default Settings Screen) so that the cost and bullwhip
patterns become more evident. In either case, you should use the same number of periods in
every round so the results are comparable with each other.
After each round you should encourage the students to review the resulting order
quantities, costs and bullwhip effect index (BEI) values over time. (Inventory levels and
fill rates can also be included to round out the overall metric review if desired.) You
will guide them through a comparison of these performance metrics among the rounds.
Note: The students should write down and/or export the results of each
game they play, for easy comparison across rounds. Alternately, they can open a new browser
tab for each round they play.
Reviewing Lessons Learned
After students have completed all three rounds of Classic Game Play, it is good to let them
lead the conversation about questions such as, What did they think of their results? Was it
what they expected to happen? Why or why not? If the supply chain performed poorly, was it
the “fault” of the student or one of the computerized players?
After encouraging the students to interpret their own results, it’s a good time to zero in
on the performance fluctuations of each player in the different rounds and introduce the
concept of the bullwhip effect. You can find more documentation on this in What
is the Bullwhip Effect? . Also, there are further discussion points for
each round in the Sample Output section below.
One of our favorite features of the Opex Analytics Beer Game is the post-game comparison,
which shows you how each of the computerized players would have performed, compared to how
you performed, if they played in your role with the same settings. This gives an
opportunity to discuss the AI player’s performance. Did the human player beat the AI, or
vice-versa?
Below we provide further insights to be discovered within
each round.
Sample Output and Lessons in Each Round
1) One Human Player + Three Human-Like Players
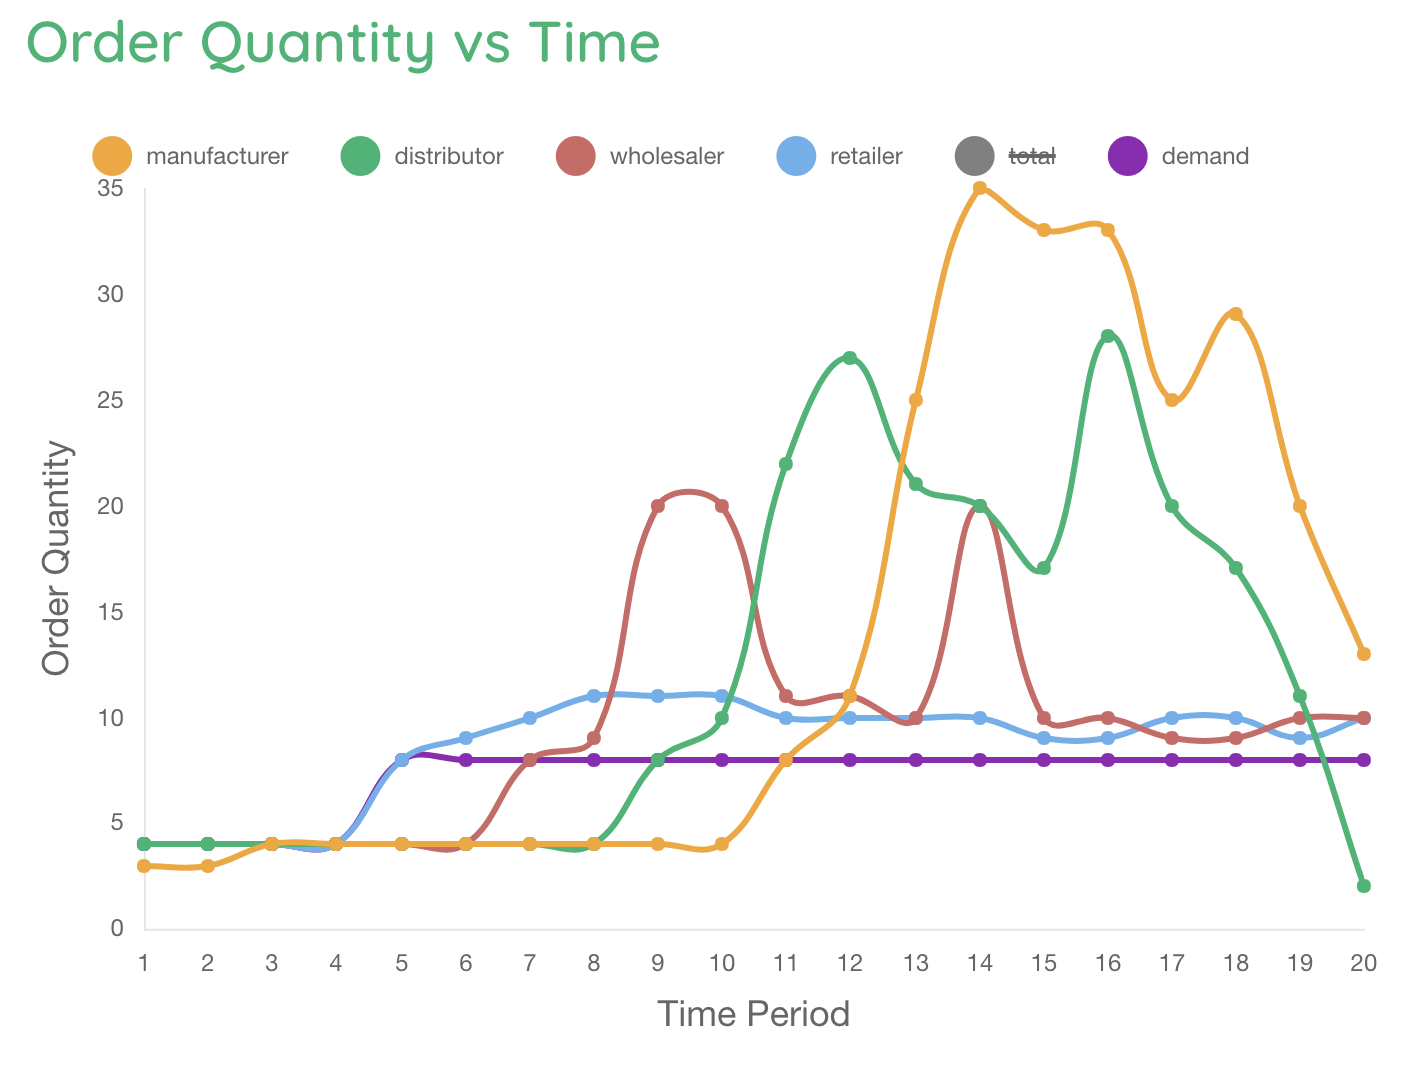
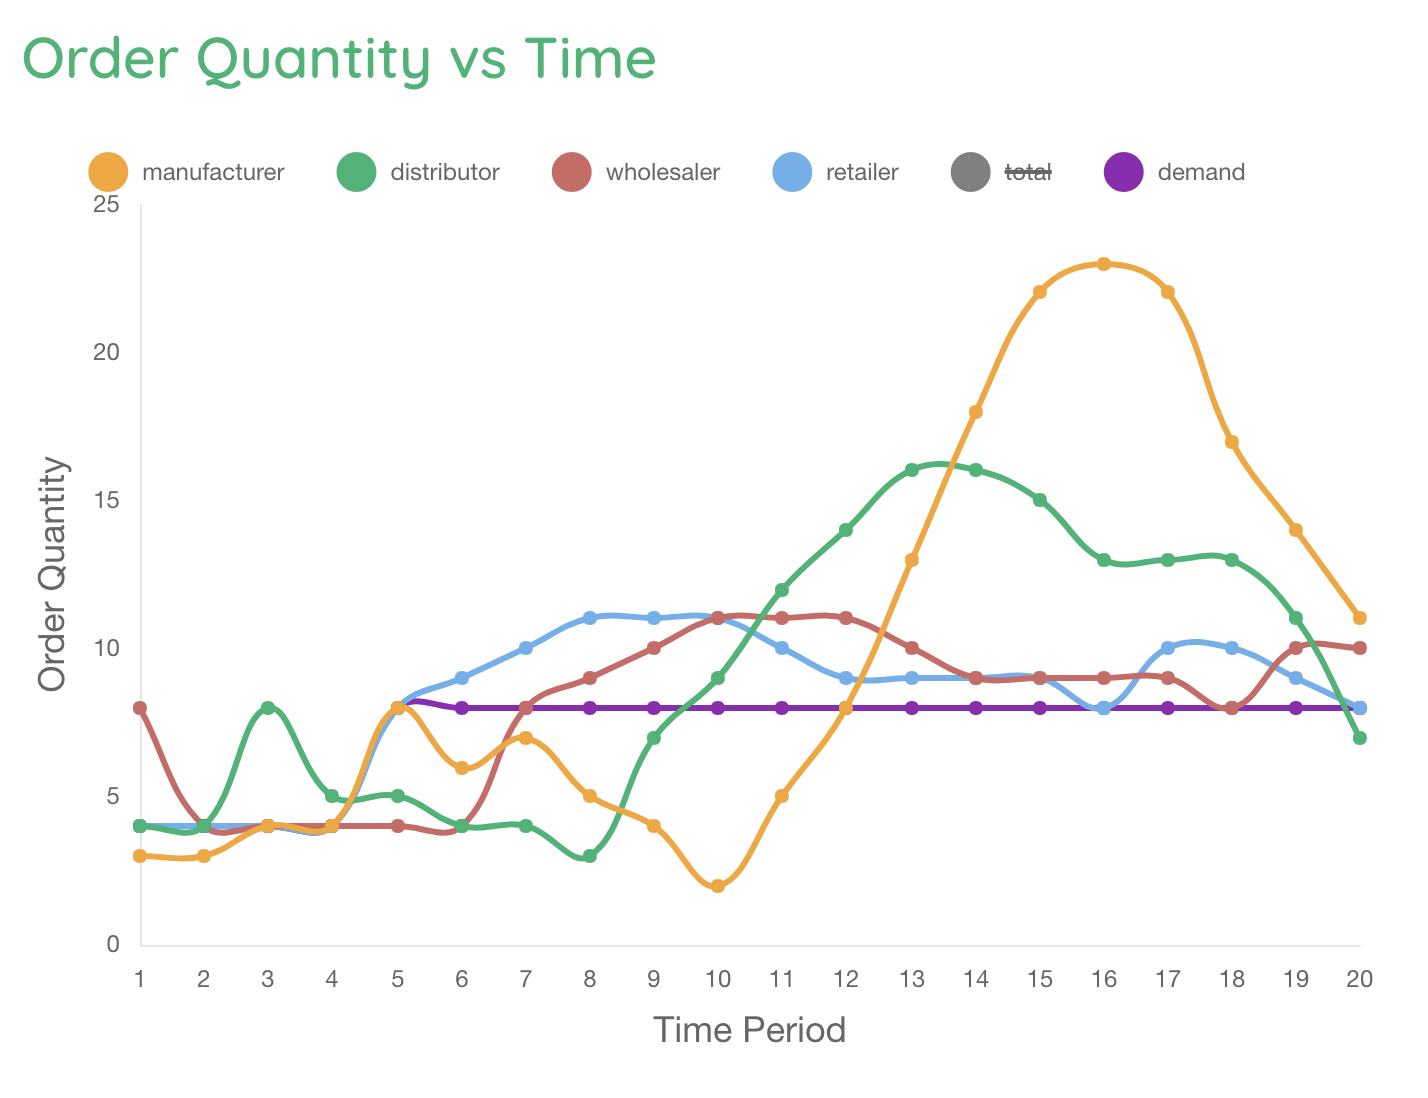
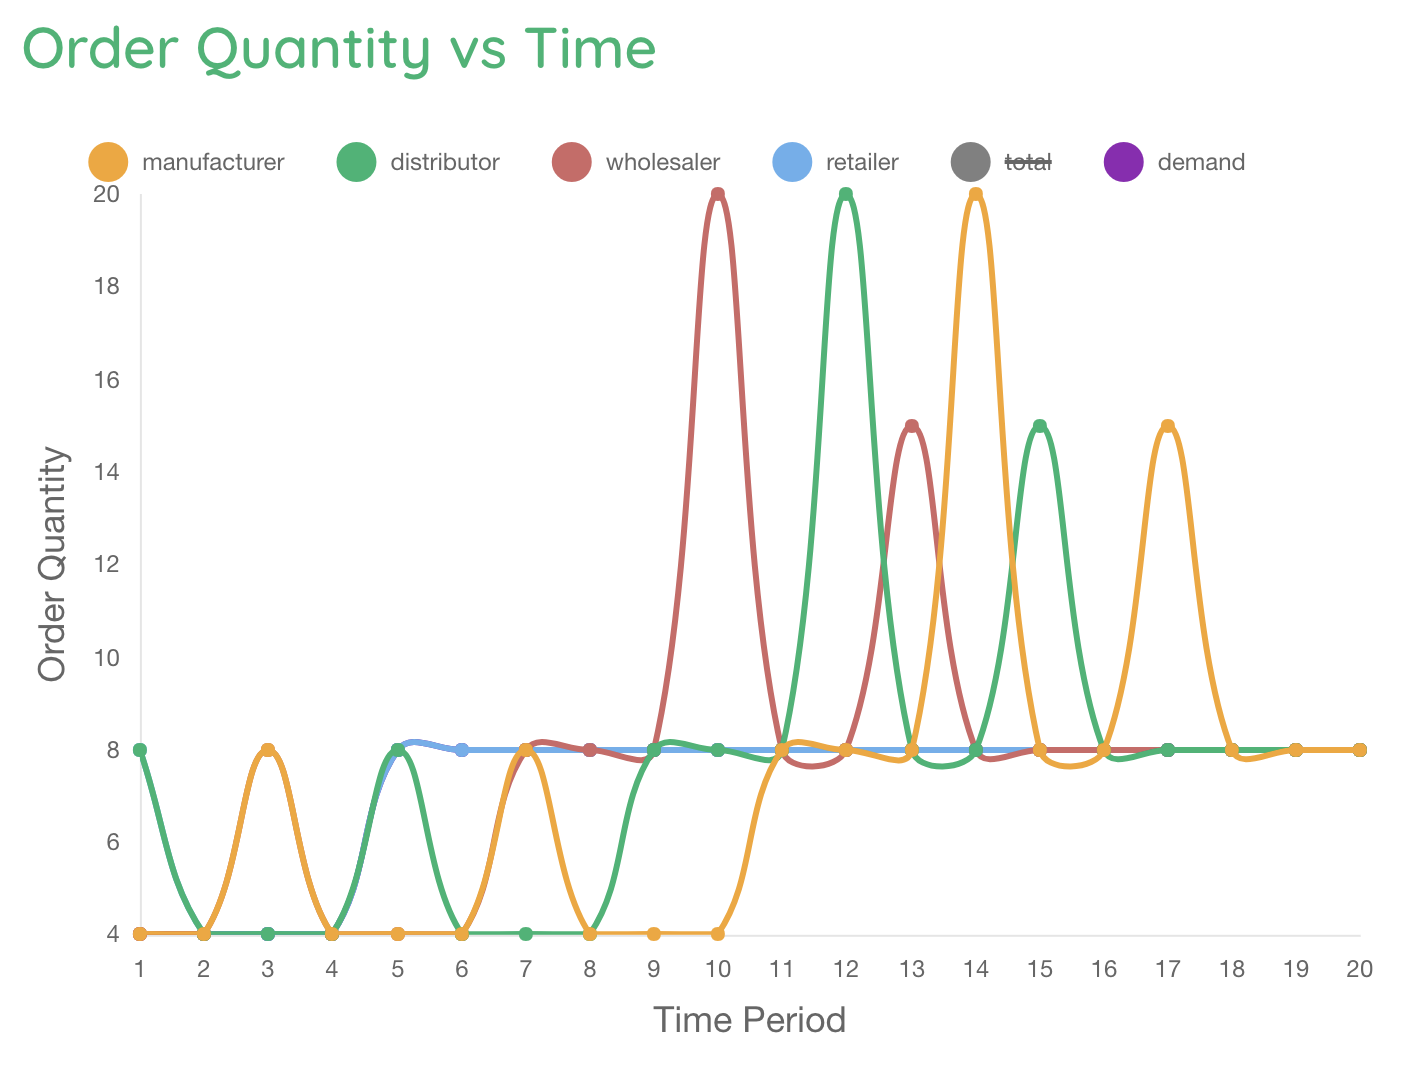
Observation: Order volatility increases as you move upstream in the supply chain (Demand ->
Retailer -> Wholesaler -> Distributor -> Manufacturer). This is the bullwhip effect! There
is also a lag of a few periods between orders of one player and the (increasingly volatile)
orders of the next, due to the order and shipment lead times.
The “human-like” players follow the formula proposed by Sterman (1989), which is meant to
emulate the way human players play the beer game. The order quantity increases when the
inventory level (IL) or inventory position (IL + on-order items) fall below a target value.
In other words, the player exhibits “panicky” behavior, over-ordering when inventories get
low, even if the correct amount of inventory is already in the pipeline. Conversely, when
inventories are high, the player under-orders, getting complacent even when there is not
enough inventory in the pipeline.
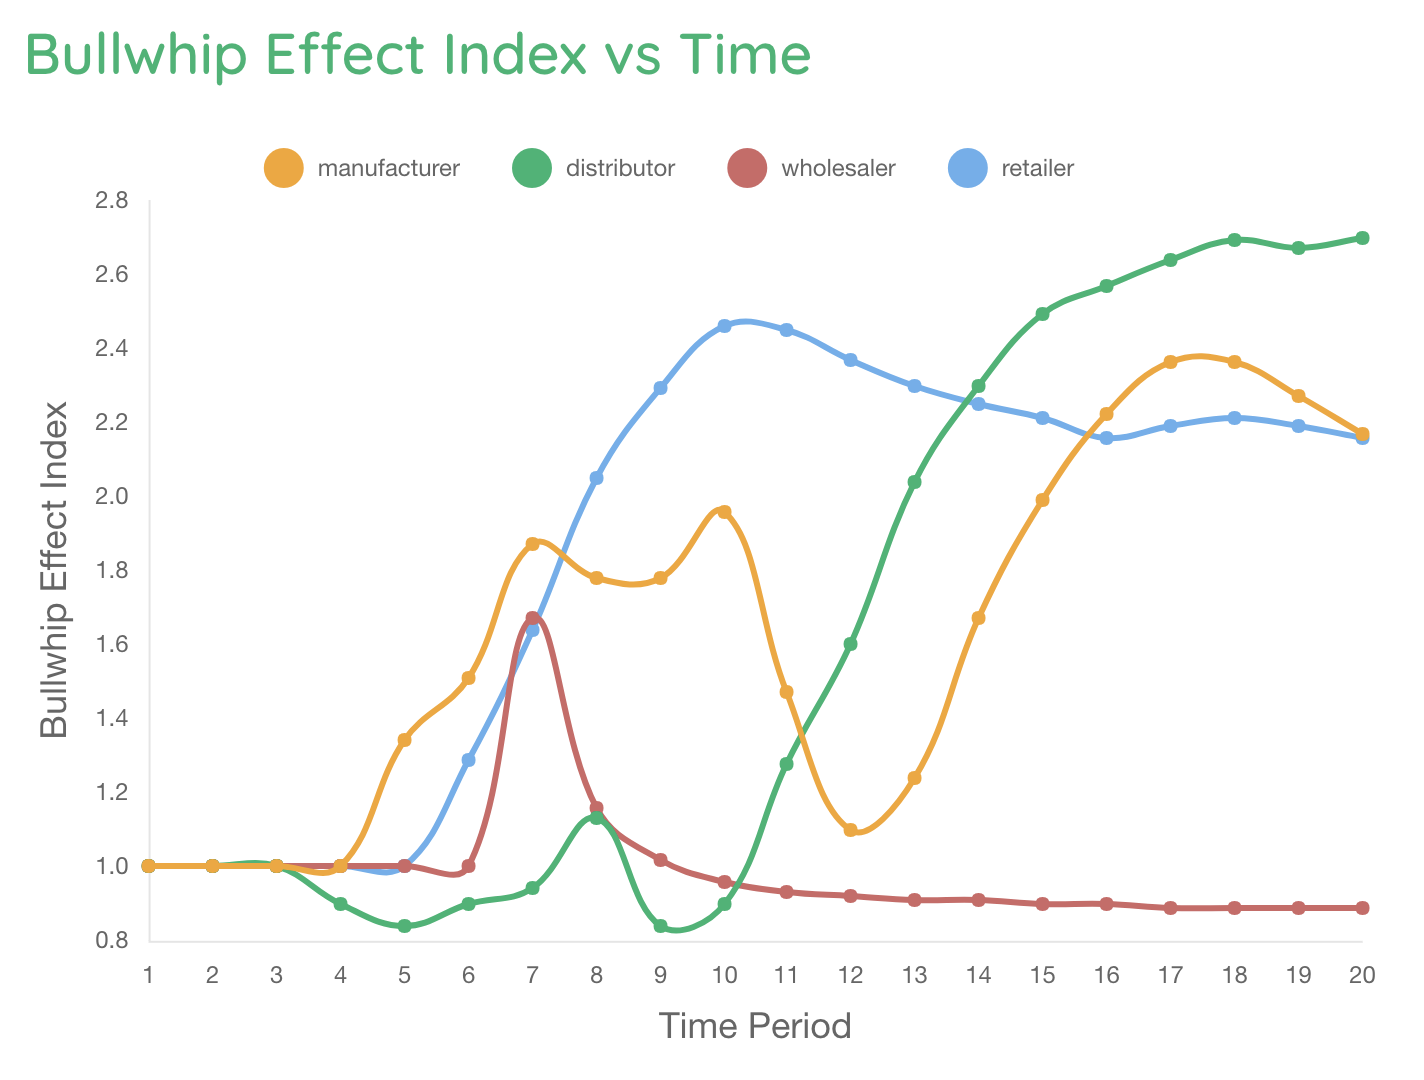
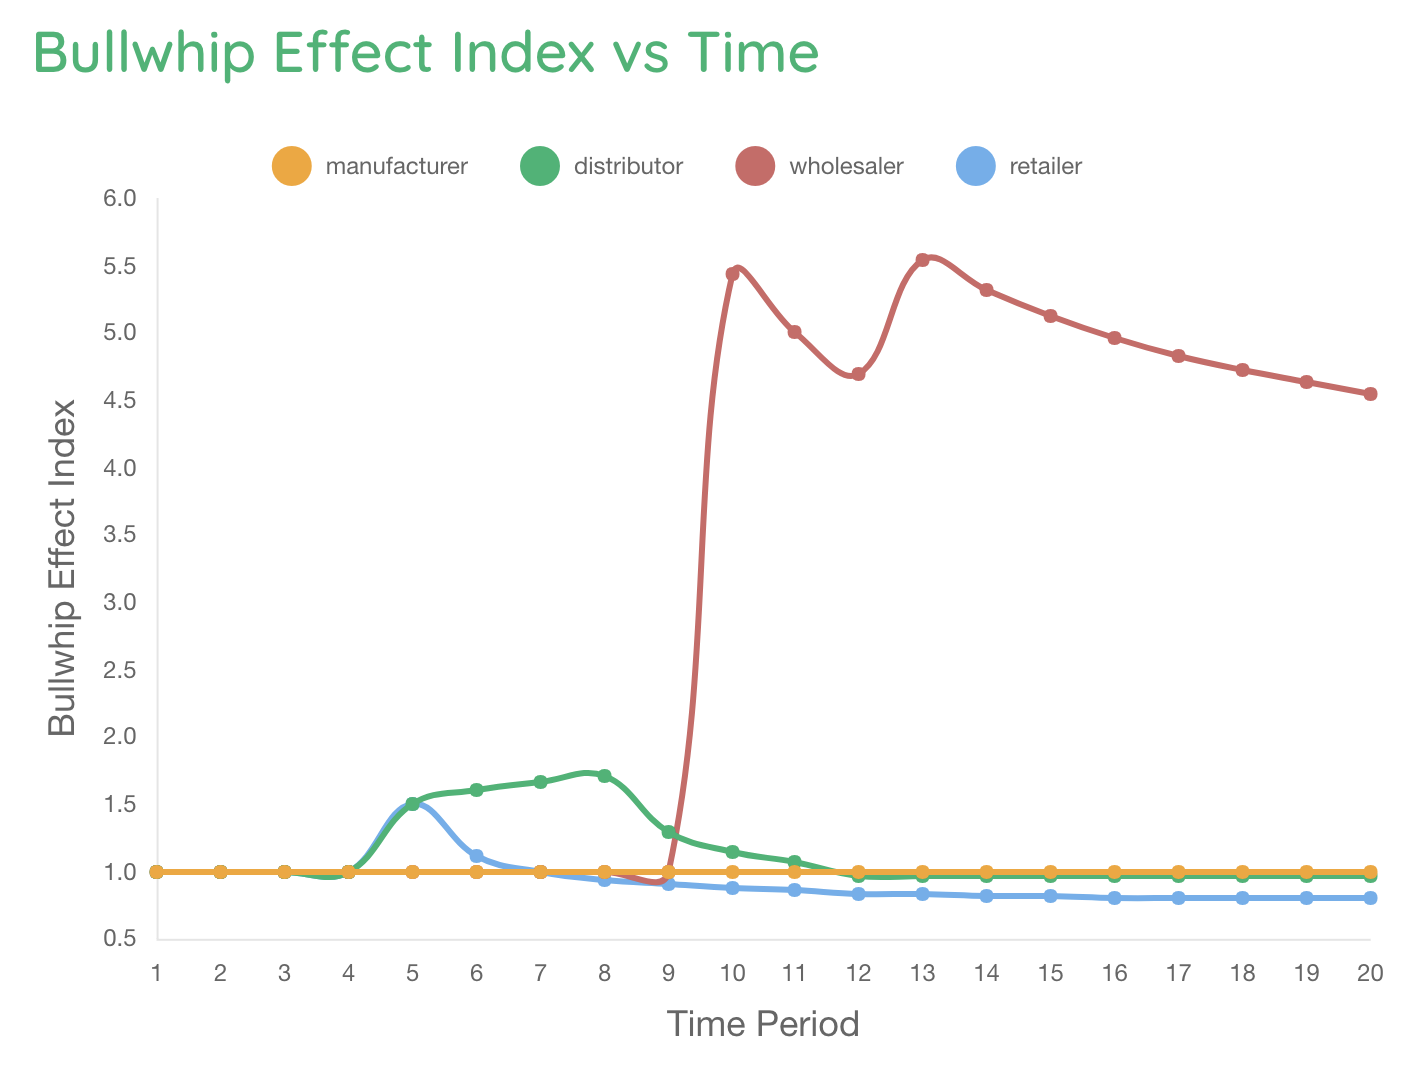
Observation: All four players exacerbated the bullwhip effect, as evidenced by the fact
that all four bullwhip effect index (BEI) scores are greater than 1. The computerized
players showed some panic in their ordering over time; the human player showed even more.
You can read more about the BEI measure in the Game Results section
Note: The BEI is a “moving variance” and thus will change throughout the time horizon of
the game. When discussing with students, simply concentrate on the value in the last
period.
Now focus on the comparison graphs displayed at the end of the game. While the student is
playing the game, the software plays the game several times behind the scenes, replacing
the human player with each of our computerized players, using the same game settings.
The software displays two graphs. The first compares the total supply chain cost (all 4
players), when the human is replaced by each of the computerized players. The second
another displays the BEI for the role the human is playing (e.g., Wholesaler) when the
human is replaced by each of the computerized players.
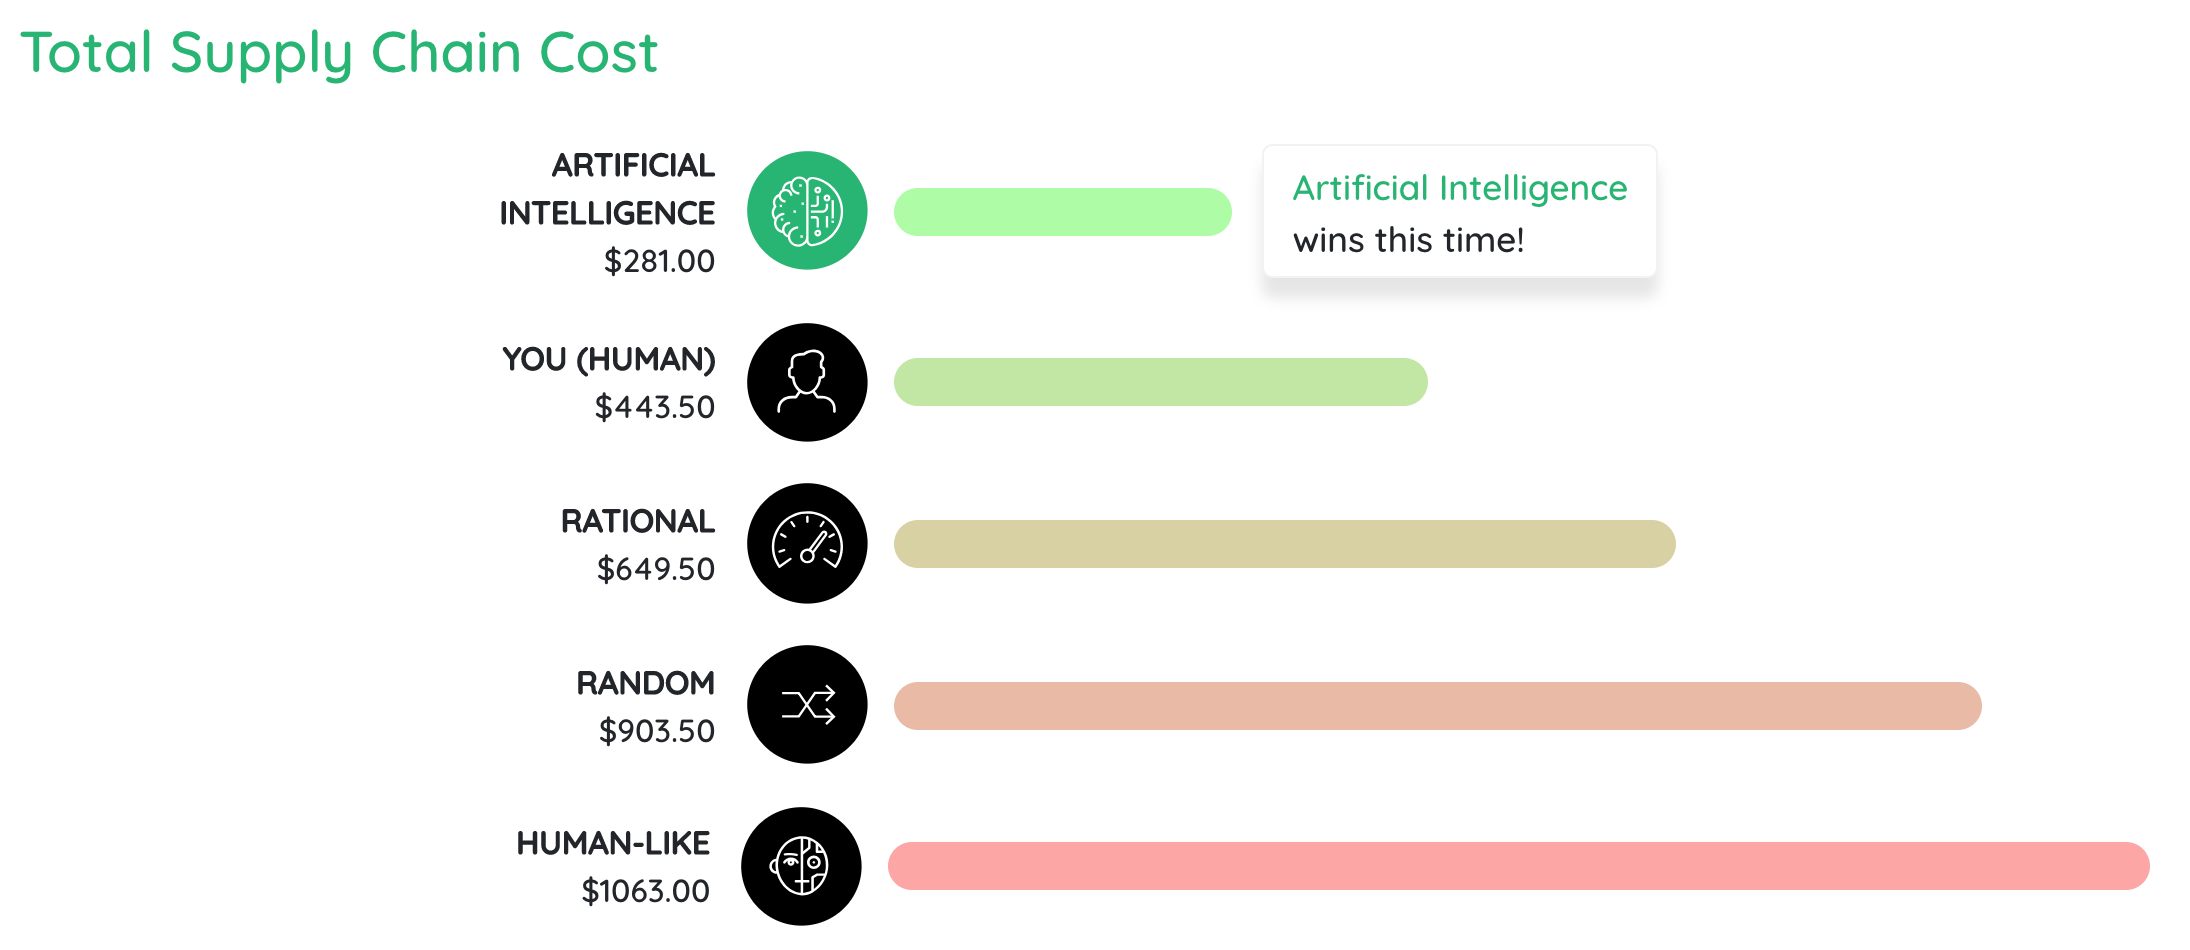
Observation: Under the Classic demand pattern with Human-Like teammates, our AI agent is
hard to beat. It achieves a cost of $281, less than half the cost obtained by a Rational
player playing in the same role, $649.50. (The Rational player uses a base-stock policy
with reasonable, though not necessarily optimal, base-stock levels.) Humans tend to perform
pretty badly in this setup — here, the human had a cost of $1,027. Even the Random player
beat our human, which is not uncommon, and can be a source of some good-natured humor in
class. In this example, the Human-Like player performed the worst, though not significantly
worse than the human.
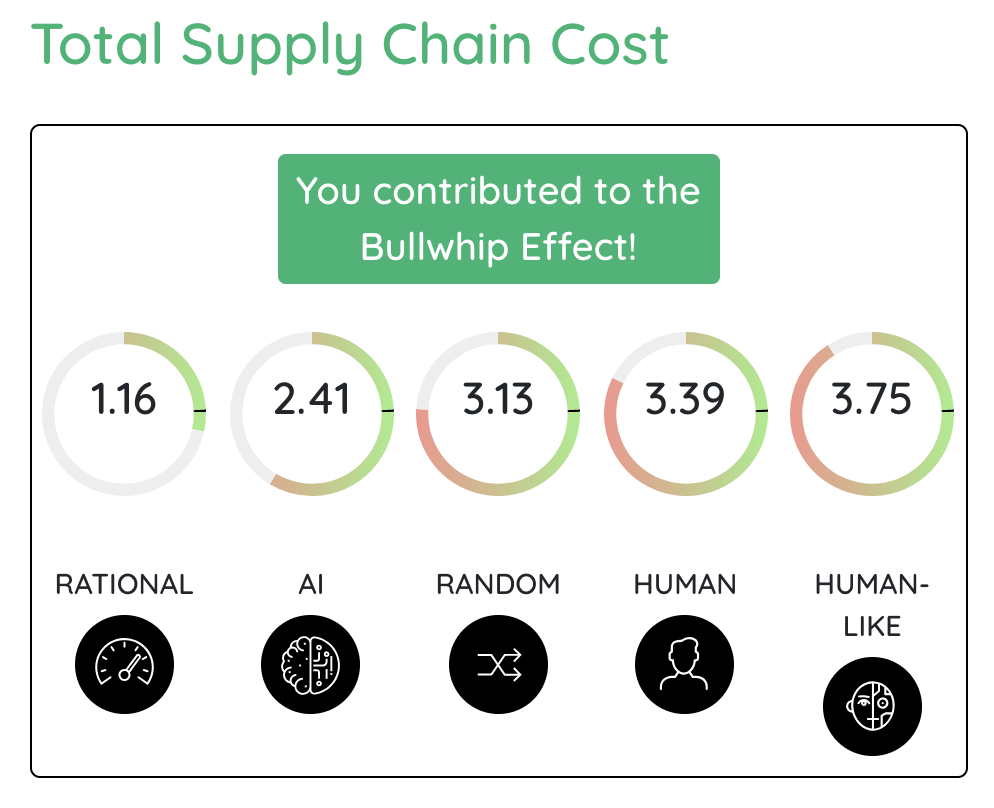
Observation: The Rational player has the lowest BEI, since it uses a base-stock policy.
(Remember that a base-stock policy, by definition, produces BEI values close to 1.) The BEI
for the AI player is quite a bit higher, even though its costs are lower, reinforcing the
point that higher BEI does not always mean higher cost. The Random and Human-Like players
had rather large BEI values, as did our human player.
Other sample output :
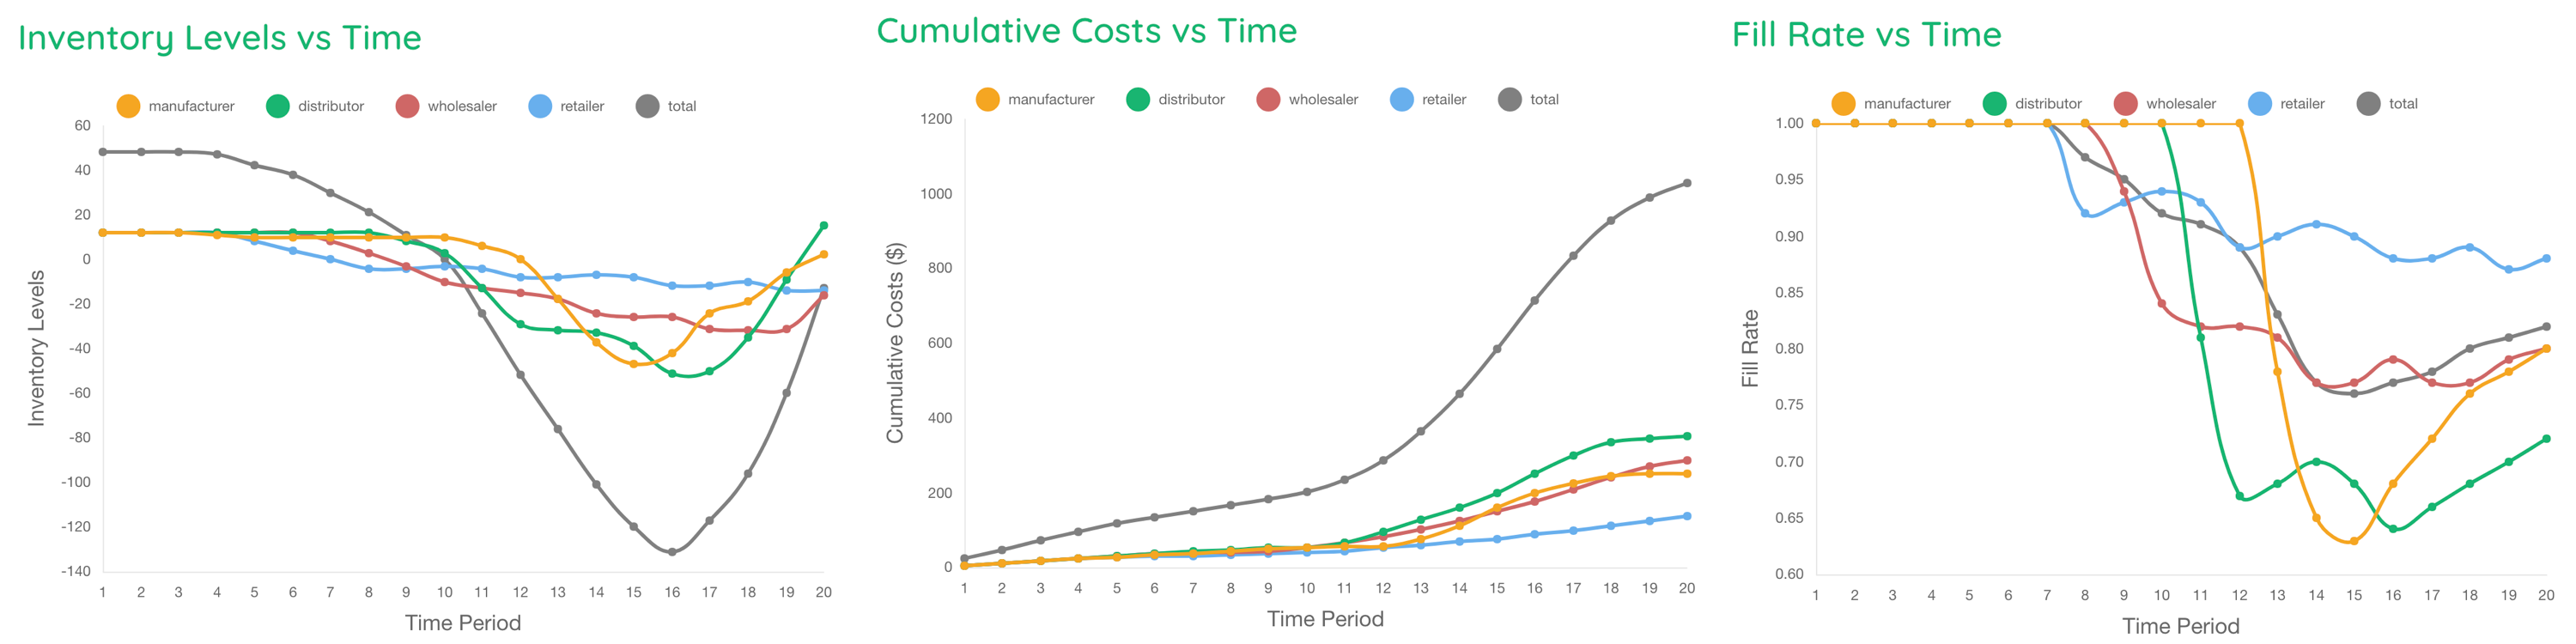
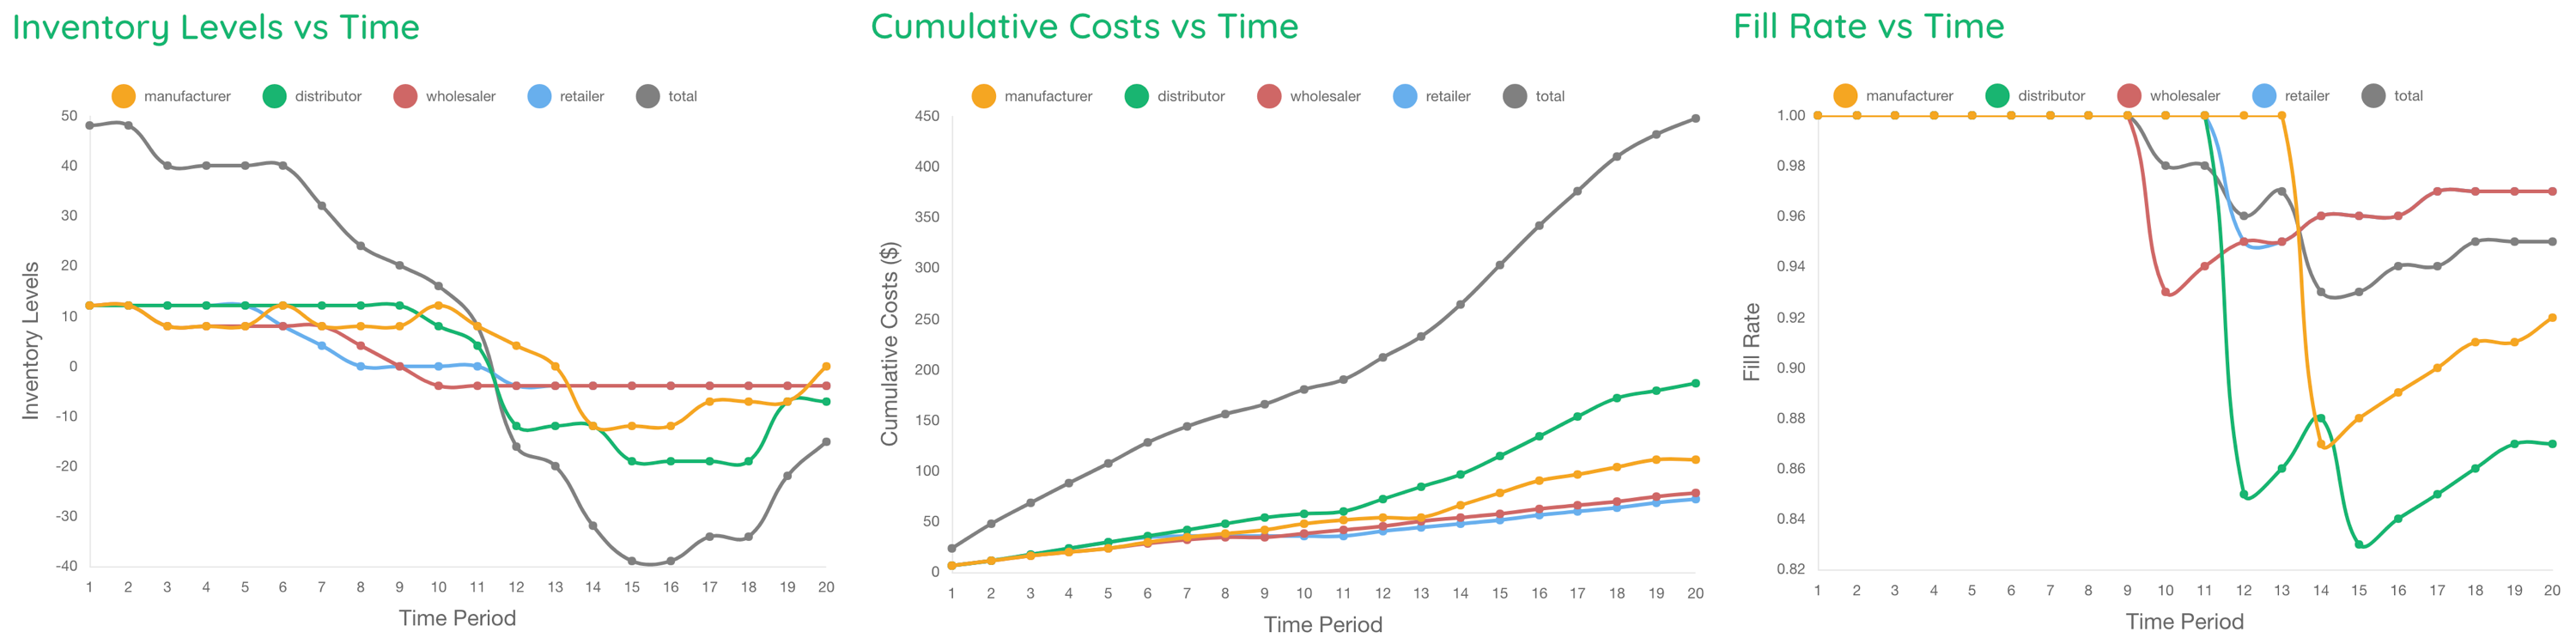
The Cumulative Cost rises continuously as time goes on (over $1,000 total cost), again
showcasing the effect of the continuous fluctuation in complacency or panic of the players
causing exorbitant carrying or stock out costs.
2) One Human Player following a Rational Strategy + Three Human-Like Players
Observation: In this case the student (playing as the Wholesaler) follows a base-stock
policy. This shows in our graphic as the Wholesaler orders are exactly the same as the
Retailer’s, two periods later. Notice that the Wholesaler neither increases nor decreases
the bullwhip effect–s/he simply passes along the orders s/he receives.
Observation: Notice that in this case the student (as Wholesaler) performs with a bullwhip
effect index (BEI) of close to 1. (It doesn’t equal exactly 1 because of the difference in
order quantities in the first period, and the lag between the Retailer’s and the
Wholesaler’s orders). This confirms that the Wholesaler neither increases nor decreases the
bullwhip effect, as we saw in the order quantity graph. On the other hand, the
computerized, Human-Like players contribute to the bullwhip effect, similar to round 1.
Other sample output
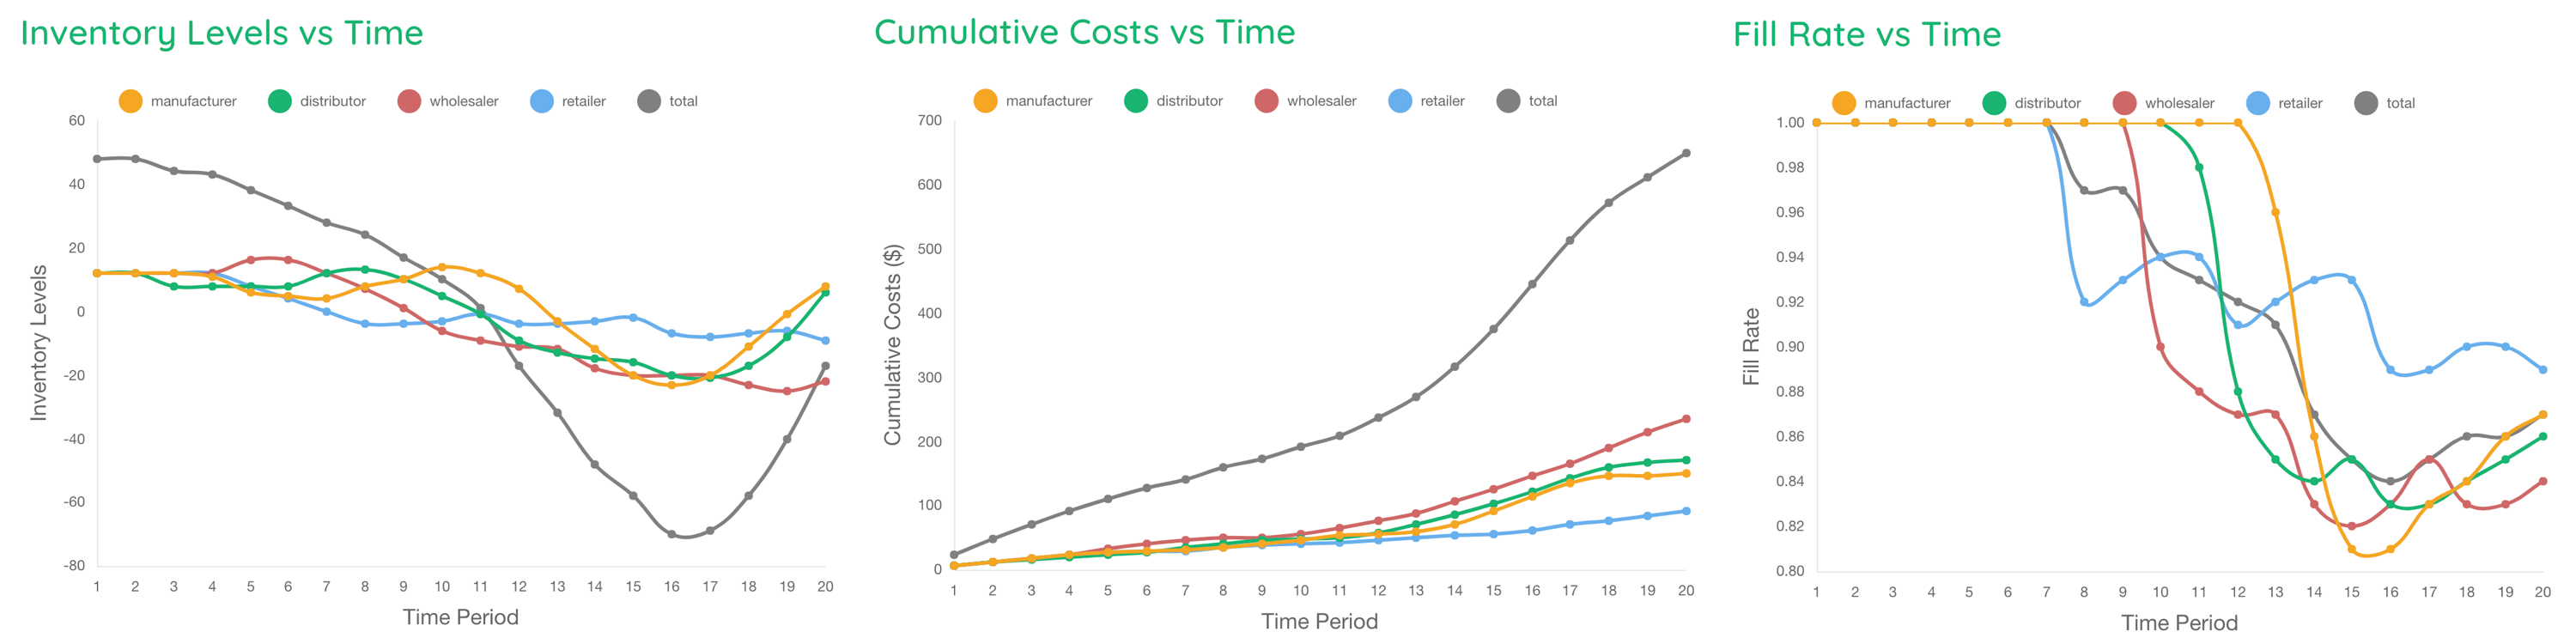
The total cost is lower than in round 1 (roughly $650 vs. $1,000), also showing the
improvement from the Wholesaler following a base-stock policy. Fill rates are better, too.
3) There are two options for how you can run the final “Classic Game Play” round.
3.a) One Human Player + Three Rational Players
Observation: Because it follows a base-stock policy, the Retailer reproduces the Demand
pattern in its own orders. (The Demand is obscured by the other curves, but you can see it
by clicking on some of the other curves in the legend to turn them off.) The Wholesaler
(the human player) breaks the pattern, but then the Distributor and Manufacturer reproduce
the Wholesaler’s ordering patterns.
Observation: As in Round 1, the computerized Rational players have BEIs close to 1, and the
human player has a much higher BEI.
Other sample output
The total cost is again lower than in previous rounds ($450 here vs. $650 in Round 2 and
$1,000 in Round 1). This shows the additional improvement from more Rational players being
added to the team.
3.b) Four Rational Players
Observation: Now each player passes along the orders that it receives, except in the first
period when they order up to the base-stock level. There is no bullwhip effect.
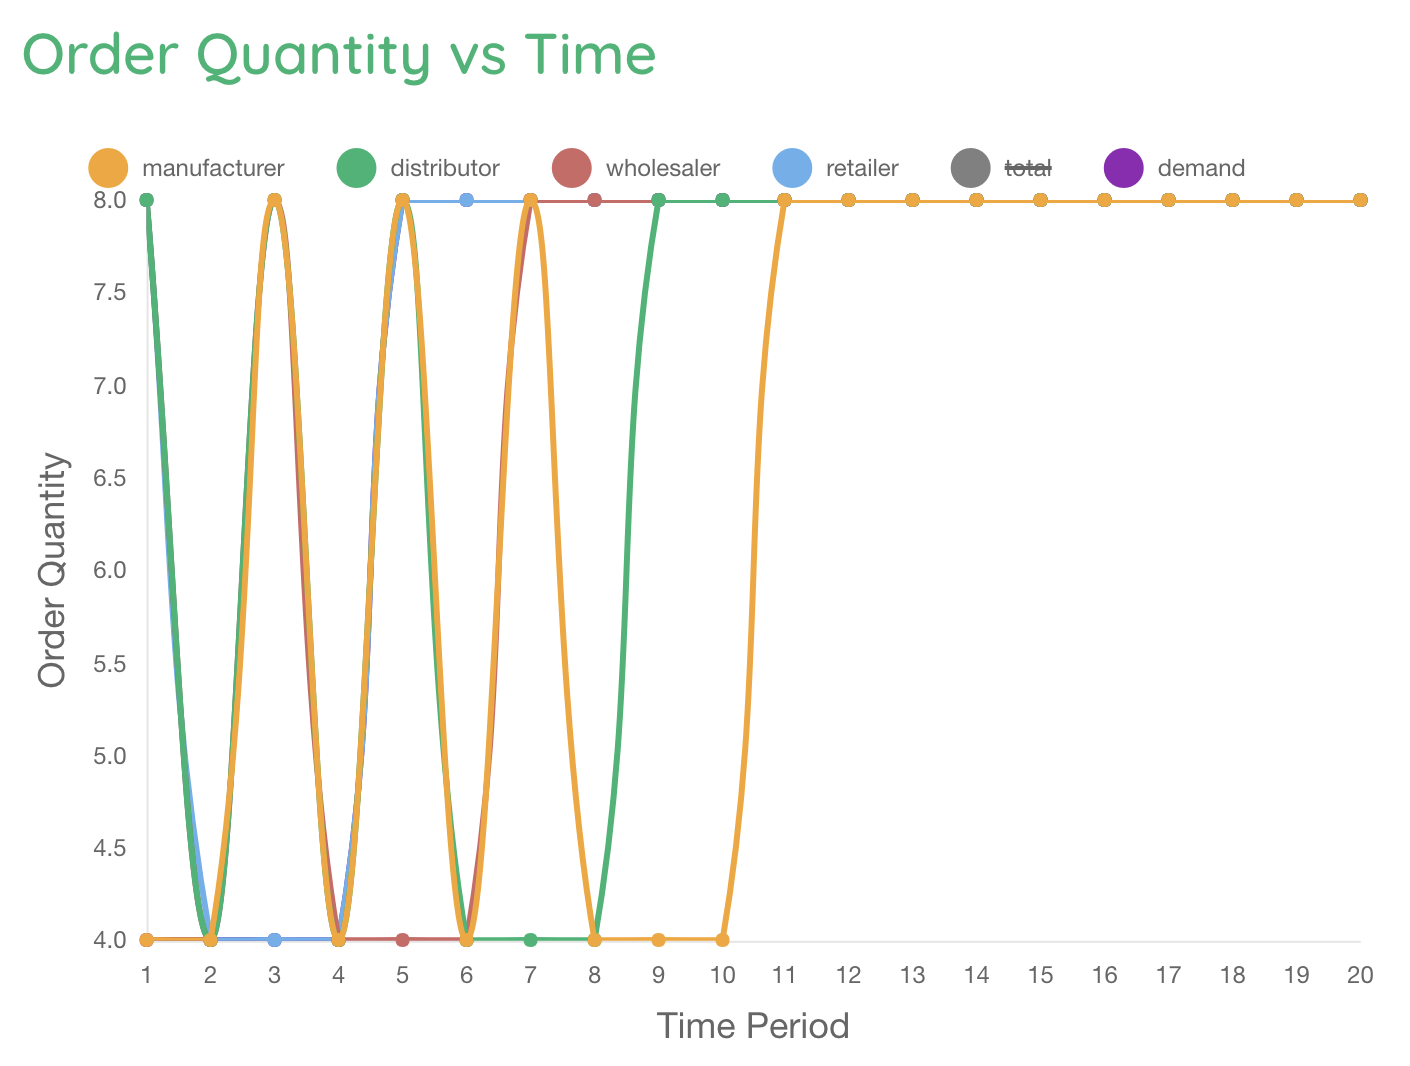
Observation: All four players have BEIs close to 1. The Retailer, Wholesaler, and
Distributor have BEIs below 1; this is an artifact of the fact that the first-period orders
differ from the demands.
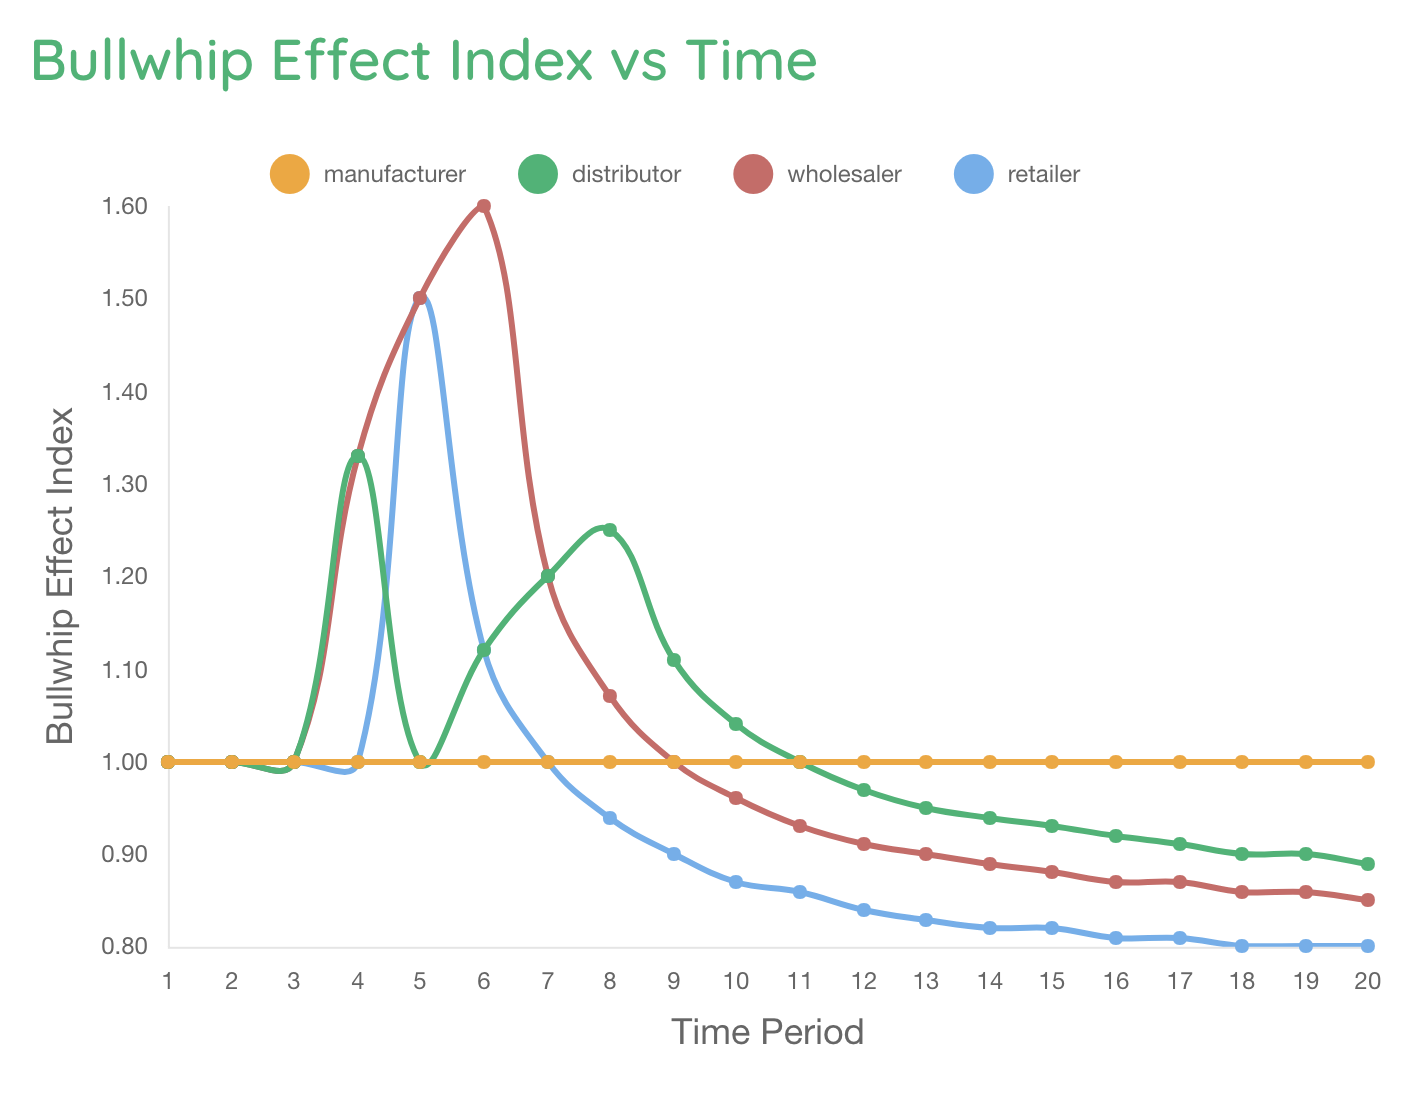
Other sample output
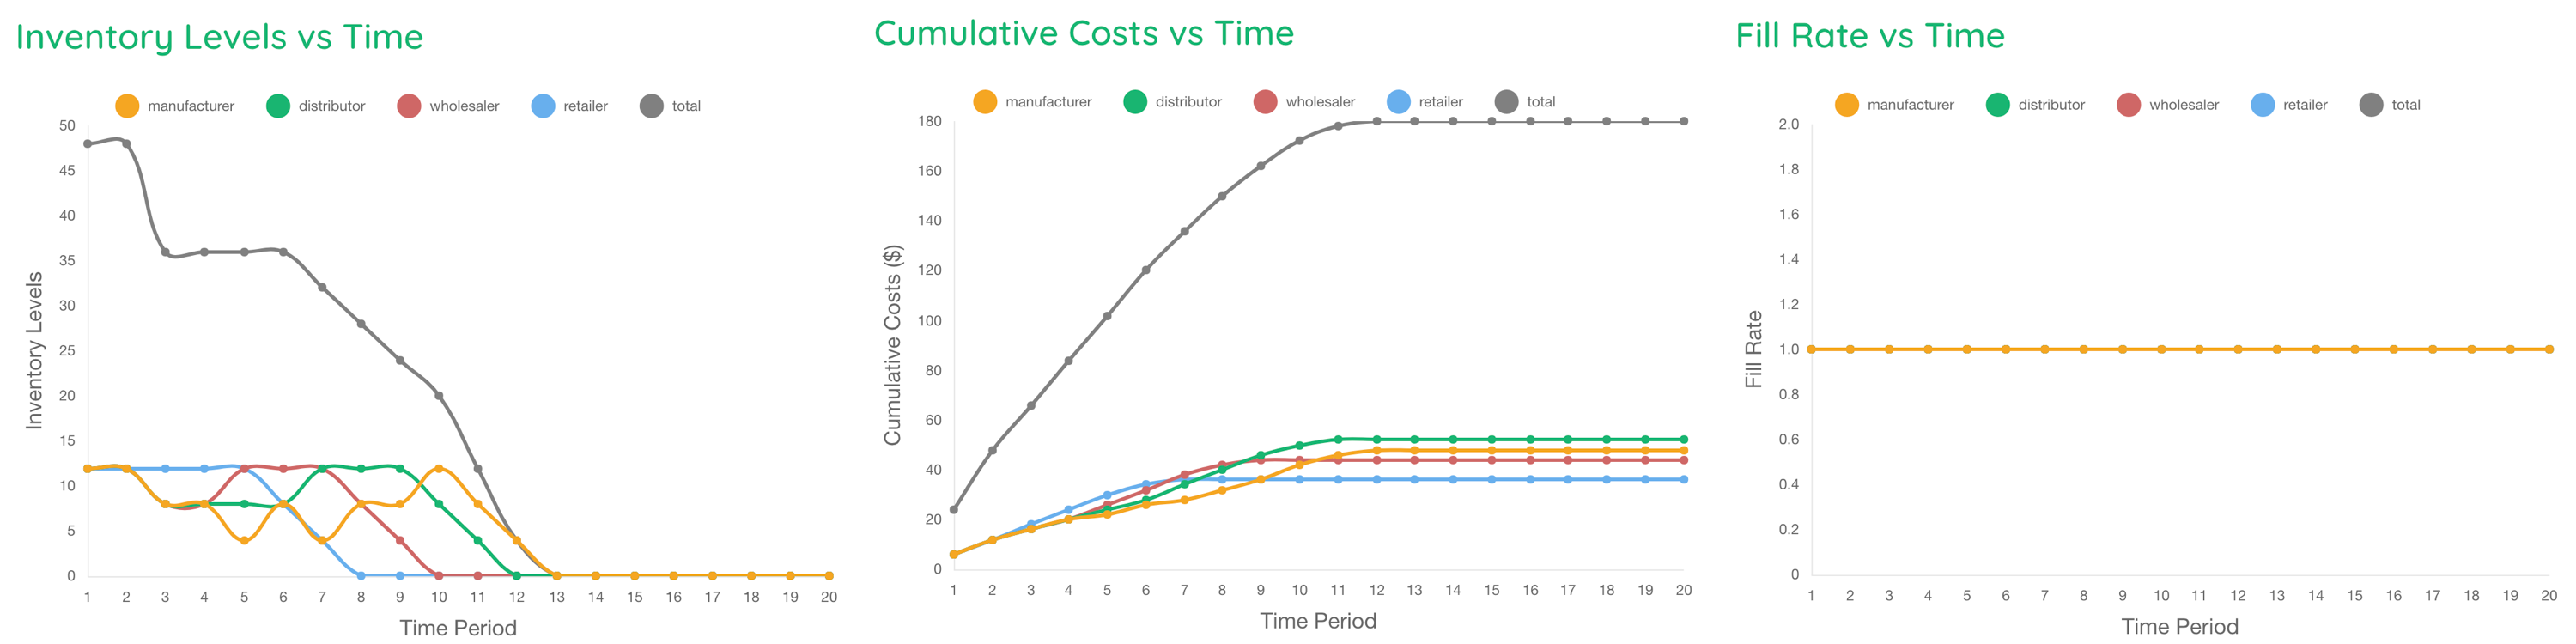
This round also represents the lowest cumulative total cost, at $180. Because the
base-stock levels are sufficiently high and the demand is almost stable, the fill rate is 1
for every player.
Can I Hire Opex to Run the Game Live?
Opex Analytics has a team of educators that are available for hire to plan and deliver
customized trainings in many areas. With a deep background in academia, Opex spends lots of
time and resources on researching, developing and delivering analytics educational
materials. We would be happy to visit your classroom or company to lead your group through
the beer game and even expand the session with lessons from other supply chain analytics
concepts as well.
Samples of other Opex Academic Materials
Supply Chain Network Design Book - http://networkdesignbook.com/
Fundamentals of Supply Chain Theory - https://coral.ise.lehigh.edu/sctheory/
Slick Oil Distribution Game - http://www.scdigest.com/experts/DrWatson_17-10-10.php?cid=13119
For more details Contact us!